Your ACES & PIES data, as the shopper sees it
Most of your product data reaches retailer pages just as you sent it. When some of it doesn’t, nobody knows until a part comes back or a sale is lost. True View Audit reads those live pages, compares them with the data you sent, and shows you what’s worth fixing first.
Automotive only, since 2013. 300,000+ product pages audited.
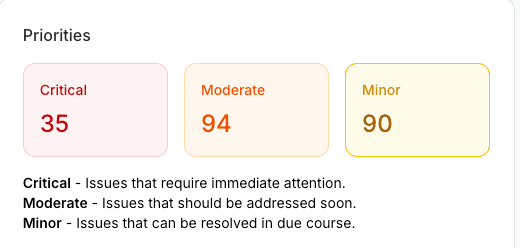
Fix in due course
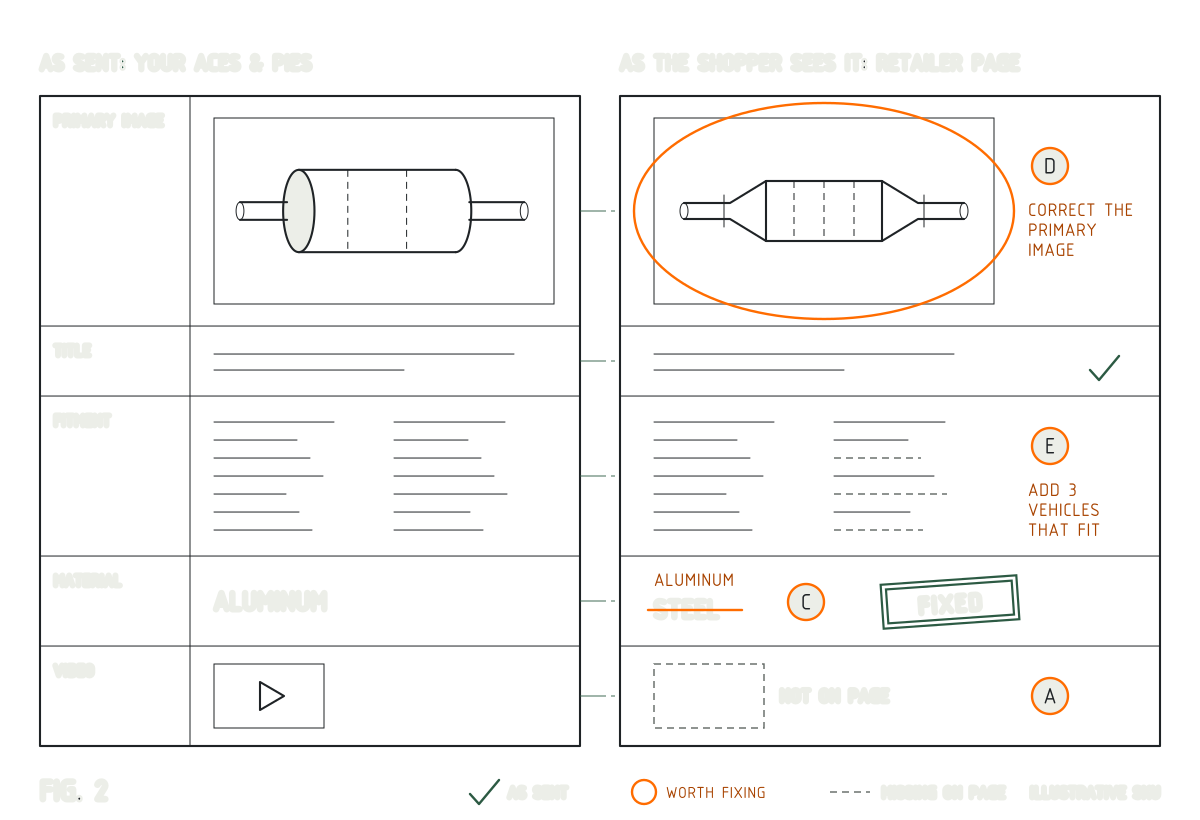
Add the product videoIt’s in your PIES, but not on the page yet.
Add the missing features4 of the 6 features and benefits you sent are on the page.
Fix soon
Correct the materialThe page says steel. The part is aluminum.
Fix first
Correct the primary imageIt shows a different part.
Add 3 vehicles that fit11 of 14 fitments listed: three sales the page can’t make yet.
Impact on sales and returns
Fig. 1. Findings for one illustrative SKU at one retailer. TVA scores each finding by its effect on sales, lost revenue and avoidable returns, and sorts it into three priorities.
What happens after the data leaves the PIM?
Feeds are mapped, trimmed and reformatted on the way to every retailer. Images get swapped, fitment gets cut short, attributes go missing, and none of it shows up in your PIM.
TVA gives brands and retailers the same view of the page the shopper sees, so you can clean the data up together.
What TVA reads on every SKU
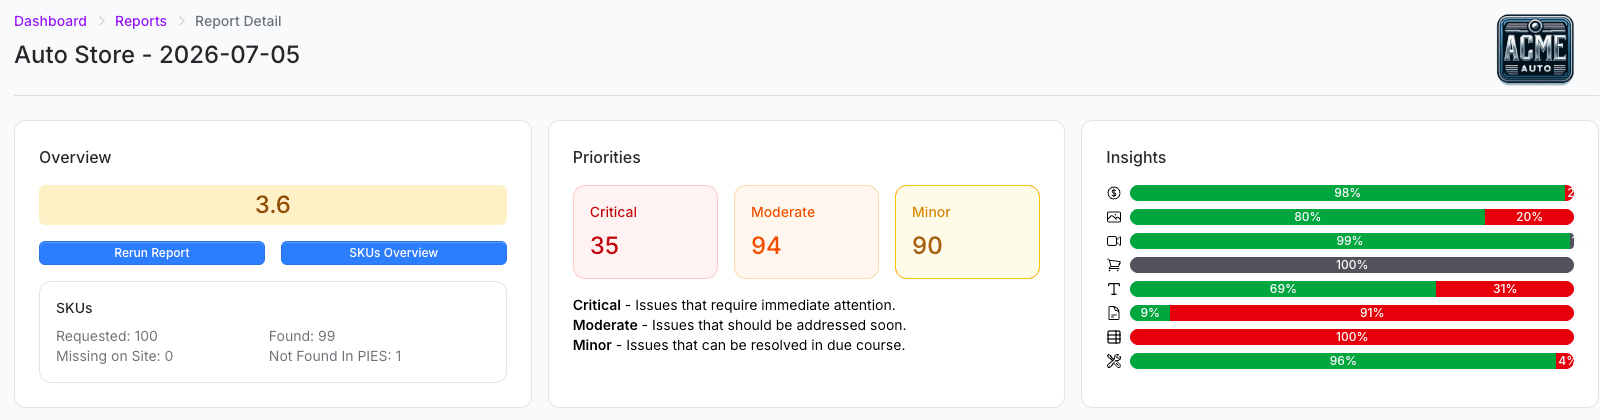
Each data point gets a plain reading: green where the page matches what you sent, orange where it’s worth fixing, grey where it’s missing. Every result can be filtered by product category.
| Item | Data point | What TVA compares |
|---|---|---|
| 1 | Title | The title on the page against the manufacturer’s suggested title. |
| 2 | Description | Whether it’s there, complete and close to the description you supplied. |
| 3 | Features & benefits | Each feature and benefit in your PIES, read as present, different or missing. |
| 4 | Price | The price shown on the page, with MAP noted alongside. |
| 5 | Attributes | Size, finish, material and the rest, against your PIES. |
| 6 | Fitment | Every make and model you sent: what’s missing, and what’s listed that doesn’t fit. |
| 7 | Primary image | Whether the primary image shows the correct product. |
| 8 | Video & assets | Whether your product videos are on the page, and how many media assets it shows. |
| 9 | Shipping | Whether the page shows the part can ship to the shopper. |
Read against your ACES & PIES
300,000+ e-commerce product pages audited against ACES and PIES data
One list for your team and your retailers
Mark each finding to fix or to ignore. TVA turns what you marked into a report card and an action plan, with a link to every SKU and the data needed to correct it.
Share it with your content team or your retail partners, so everyone works from the same list and the data gets cleaned up at the source.
- Side-by-side comparison of your data and the page
- Tag each finding to fix or to ignore
- Comparisons as a table, CSV or JSON
- A report card and action plan to share
Built for brands, useful to retailers
The same audit works from either side of the feed.
MagnaFlow Group has had great success utilizing TVA to audit product content and improve content quality on the market. TVA has allowed us to quickly and effectively verify that content is accurately consumed and displayed by our trading partners.
Josh L., Product Content Manager, MagnaFlow Group
Guides
Three places to start, depending on what matters most to you this quarter.
| Item | Guide | What it covers |
|---|---|---|
| 1 | Reduce returns | The fitment, image and attribute gaps that send parts back, and how to find them. |
| 2 | Boost your sales | Missing fitment, media and product information that cost a sale. |
| 3 | Protect your reputation | Complete, accurate pages that earn a shopper’s trust. |
Getting started is simple
Send us what you want checked, and we’ll set up the first audit with you.
You send
- The SKUs to check
- The websites to check
- ACES and PIES files for the brands (we can help with this)
- How often to audit (or run audits on demand)
- Who to notify when an audit is done
You get
- A dashboard login with every report
- A notification when each audit is done
- Email support from the Bridge Below team
Book a test drive
See TVA working on your own data. Book a demo, or send us up to 100 SKUs and we’ll check them for free.
Phone
334-444-2942
Offices
Anaheim, CA
Auburn, AL