Make sure your pages show what the brand sent
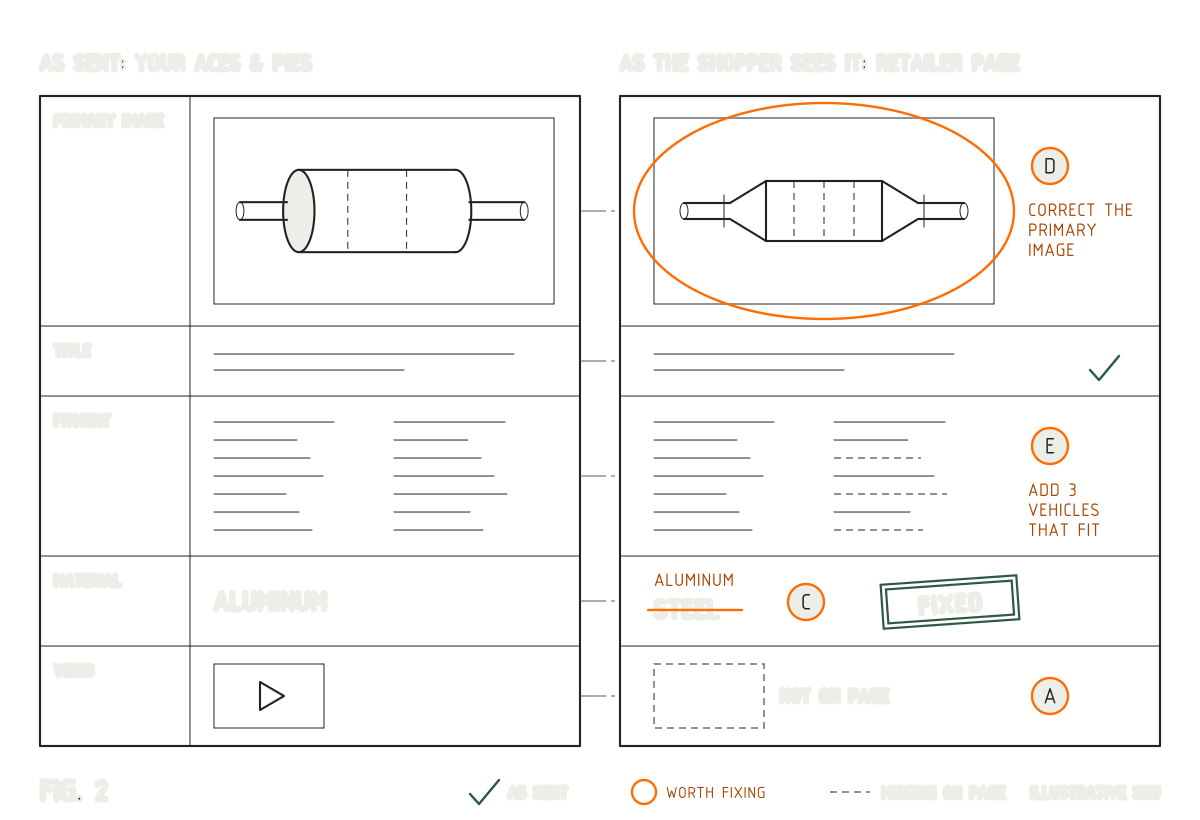
Feeds change on their way into your store. TVA reads your live product pages against the manufacturer’s ACES and PIES data, so you see your frontend the way shoppers do and know what to fix first.
Why retailers use TVA
- More salesPages that carry the brand’s complete, accurate ACES and PIES data sell more.
- Fewer returnsCorrect fitment and images on the frontend mean fewer parts sent back and restocked.
- Shopper trustAccurate descriptions, images, fitment and attributes, straight from the feed.
Find what matters, fast
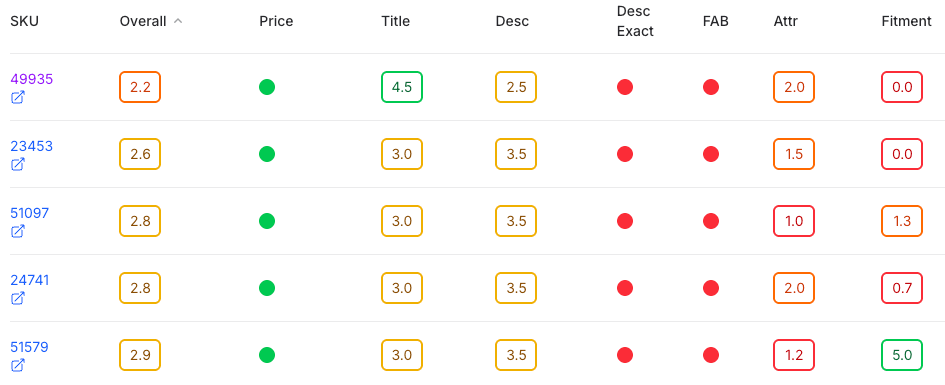
TVA scores each finding by its effect on sales, lost revenue and avoidable returns, so your team starts with the fixes that pay back most.
| Item | Finding | How TVA reads it |
|---|---|---|
| 1 | Fitment | ACES and PIES, combined with AI, compare your standardized fitment with the vehicles each page lists. |
| 2 | Primary image | AI checks whether the primary image on the page shows the correct product, and flags it for review. |
| 3 | Attributes & features | Every product attribute and feature, ranked from minor to major. |
SKU by SKU
View every finding on a SKU and decide, in one place, whether to fix it or ignore it.
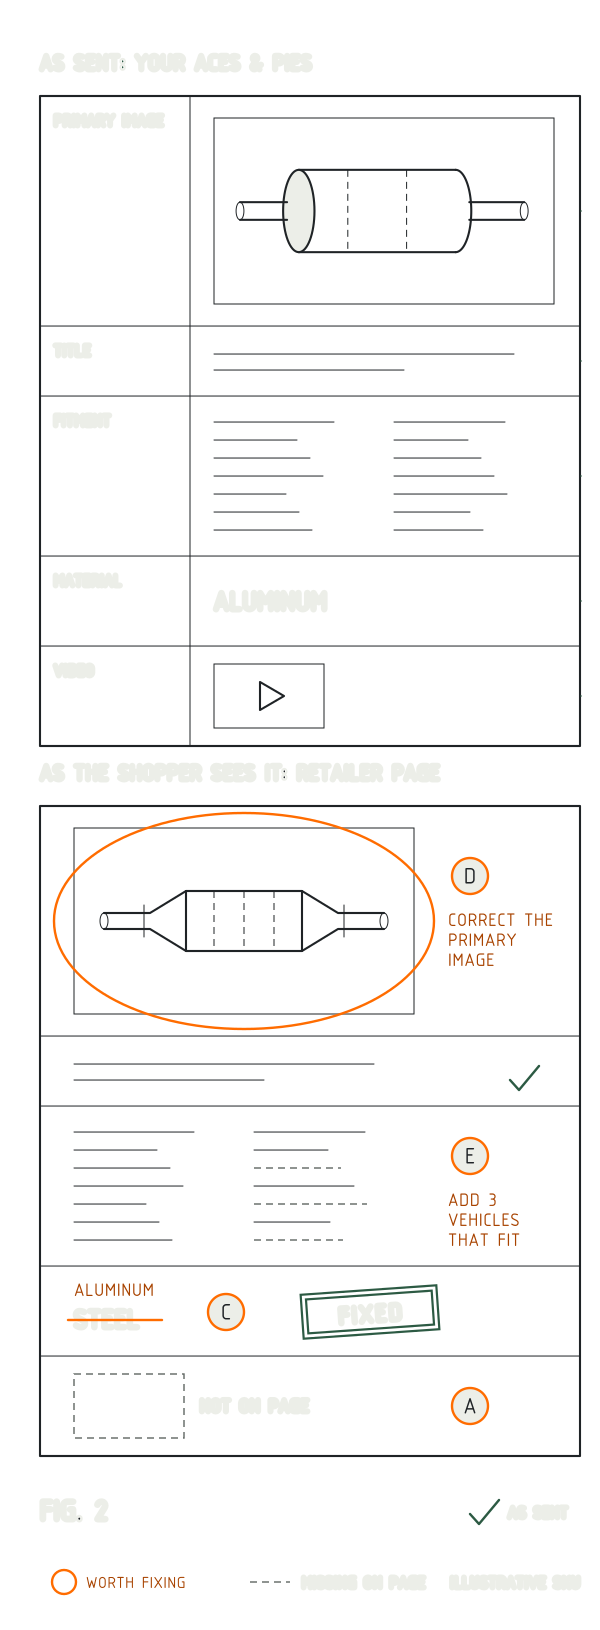
- Side by sideStandardized product data next to the page data, for an easy comparison.
- Tag to fix or ignoreMark each finding as needs fixing, or ignore it.
- JSON comparisonsThe same comparison, as JSON.
- ShareOnce findings are reviewed and marked, share a report card and action plan.
Reports you’ll actually read
- Clear reportsNo more spreadsheets. Easy-to-read reports put what’s worth fixing at the top.
- Powered by AITVA compares pages with ACES and PIES data quickly and precisely, at scale.
- Quick to useCategorized, sortable, filterable views, plus ready-made reports to share.
Book a test drive
See TVA working on your own data. Book a demo, or send us up to 100 SKUs and we’ll check them for free.